Query Metrics
Overview
You can use the Query Metrics widget to obtain an overview of all the entities, associations, and source breakdown. This is useful for investigating complex ontologies produced when merging unstructured and structured data.
About Query Metrics
The general visualization approach is to highlight aggregated statistics i.e. the frequency/significance of entities & associations, document & entity counts by hour/day/week or clustered by geo, etc. The Query Metrics widget is useful for getting an overview of the data and the ontology used to index entities and associations.
Using the Widget
You can use the Query Metrics widget to get an overview of the sources, entities and associations that are comprised by your query.
Viewing Results
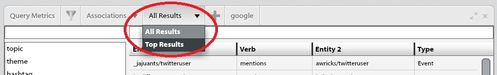
There are two result types for the Query Metrics widget: All Results and Top Results.
To view "All Results"
- From the Query Metrics widget, ensure that "All Results" is selected for results type. This shows shows approximately the the top 100 entities/associations.
To view "Top Results"
- From the Query Metrics widget, ensure that "Top Results" is selected for results type. This shows all of the entities/associations within the top 100 documents (normally more than the "All Results").
Setting Advanced Options
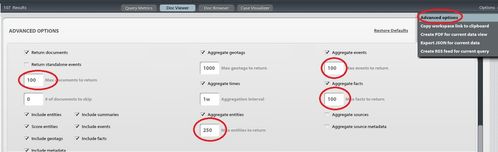
The number of aggregated entities and associations returned can be controlled by the advanced options page.
The following parameters can be controlled
- Max documents to return
- Max entities to return
- Max events to return
- Max facts to return
For more information, see Advanced Options.
There is a trade-off between fidelity and performance (and the defaults seem to be a good compromise across a variety of use cases).
In this section: