Visualization Widgets User Guide
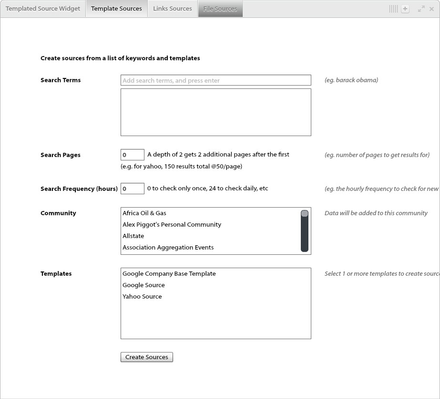
Once you have selected your sources, run a query, and have returned results you will want to visualize your data using visualization widgets.
Read the section Common Functionality to get up-and-running with Widget usage basics and best practices.
The following visualization widgets are supported by IKANOW
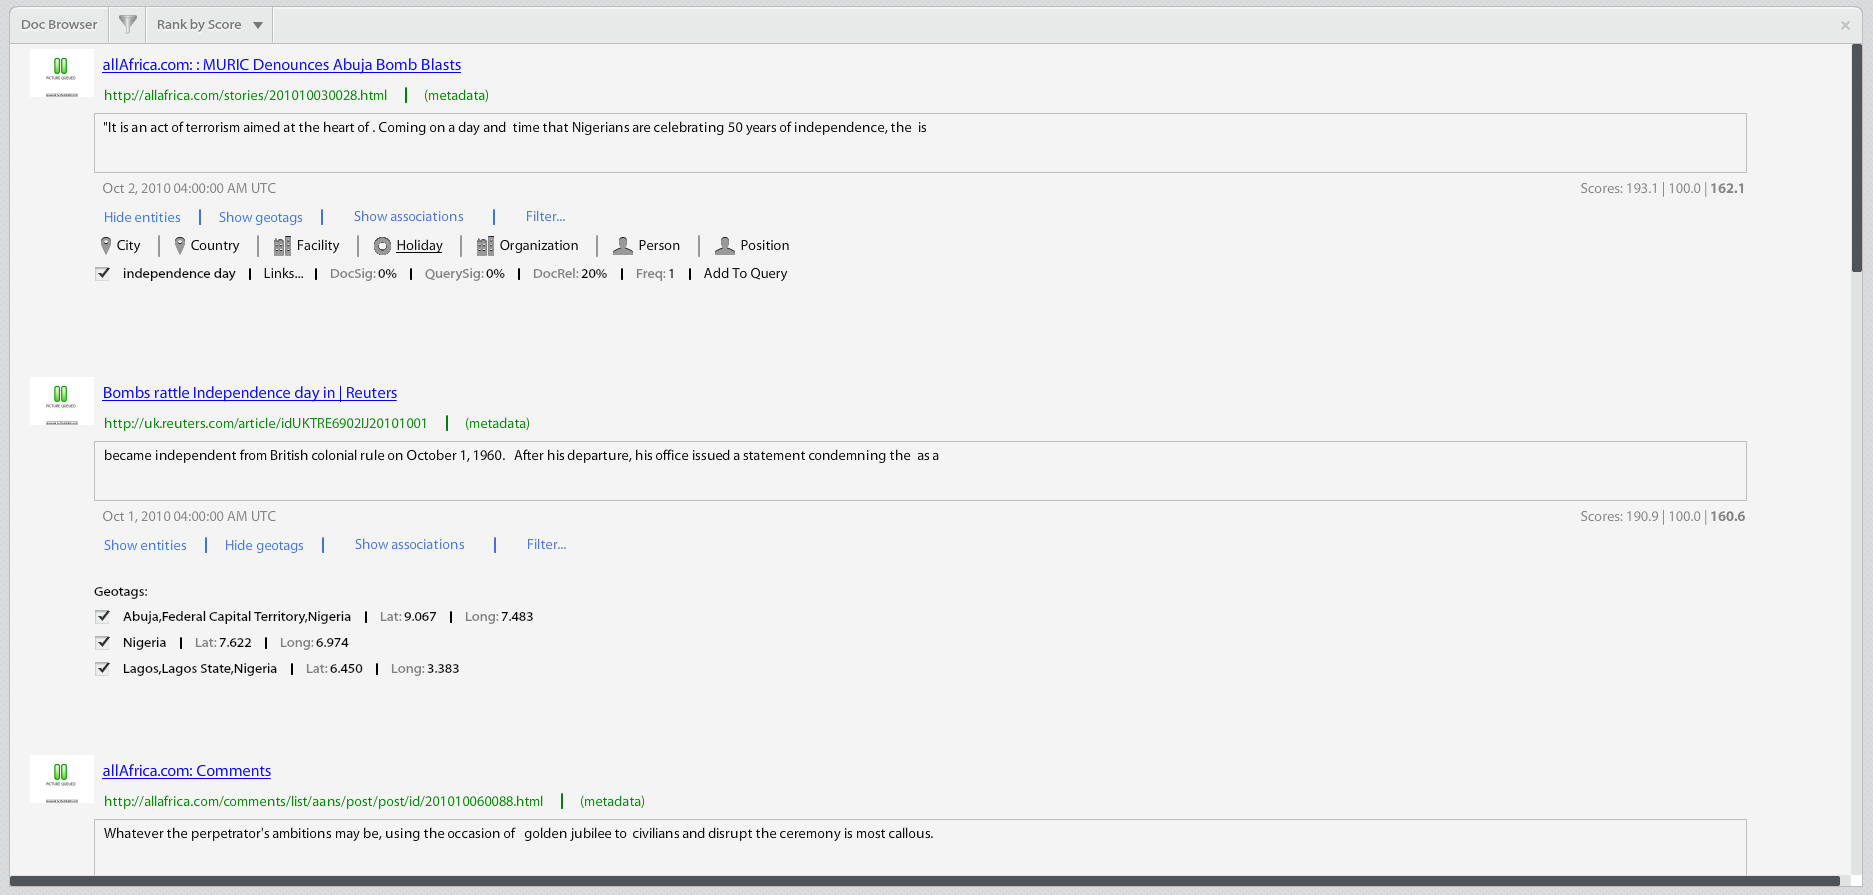
Doc Browser:
List and detail view of query results, including the source URL, preview of the document text, scoring results, and a breakdown of the entities, associations, and geotags in each document.
Doc Viewer: (enterprise)
List and detail view of query results, including the source URL, preview of the document text, scoring results, and a breakdown of the entities, associations, and geotags in each document.
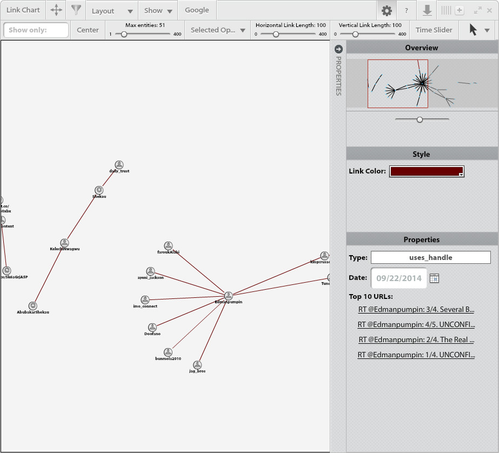
Case Visualizer: (enterprise)
A canvas for building manual link analysis charts. Users can drag entities, associations, and documents from other widgets onto the graph editor to build out custom graphics. These nodes and edges are then documented in the case manager or exported as image files for use in products.
Bar chart visualization ranking entities using metrics such as significance, coverage, and frequency.
Custom Viewer - Map: (enterprise)
Very simple geospatial widget for rendering the result of custom plugins that contain geospatial keys.
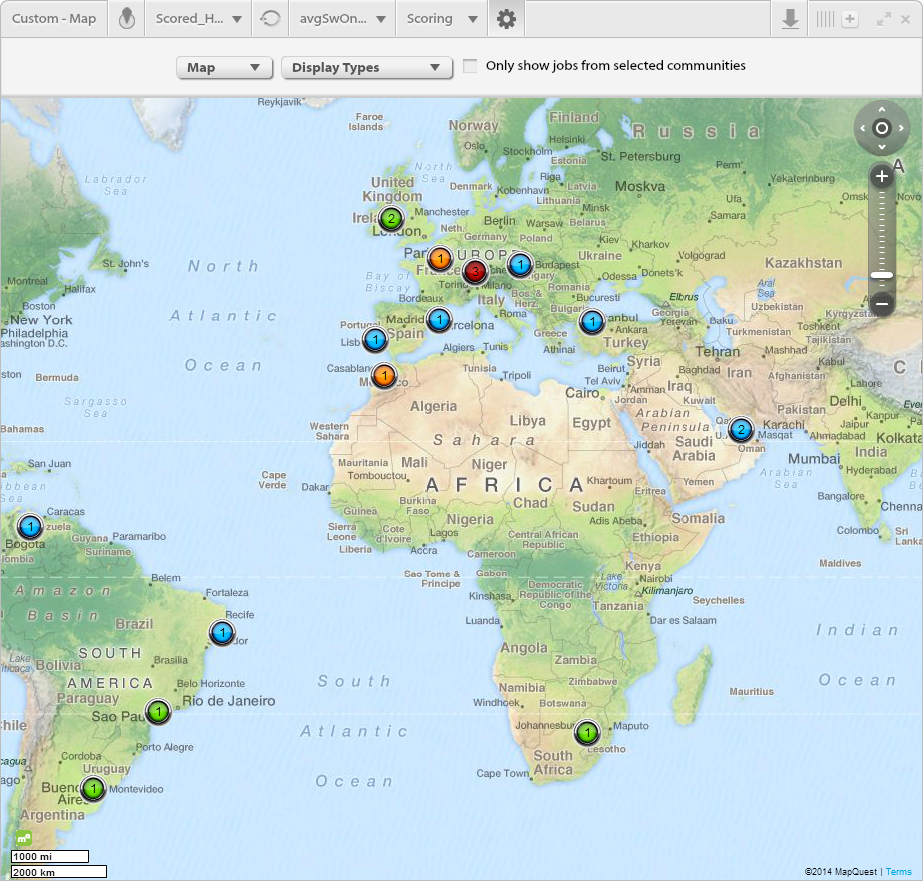
Geospatial view of the geo tags extracted from the documents returned by a query, as well as a heatmap of document densities.
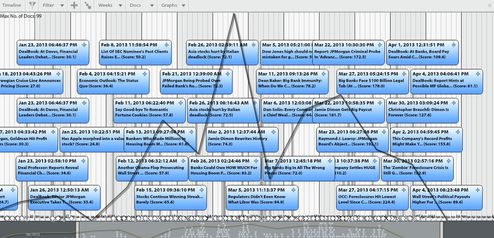
Temporal analysis of the document results.
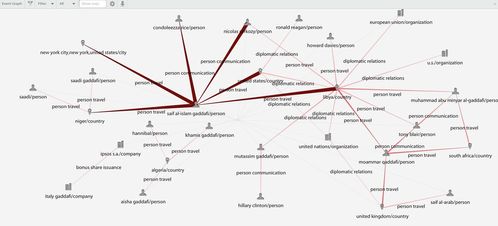
Semantic graph visualization of entities and associations returned by the query and provides sub graph functionality by filtering the entity categories.
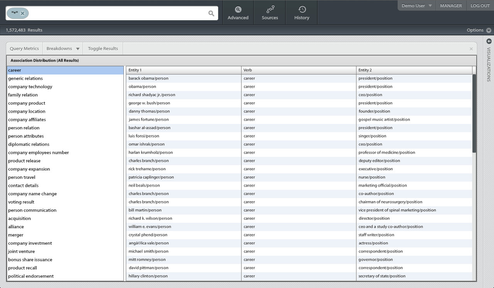
A widget that provides a high level view of the entity types and association categories.
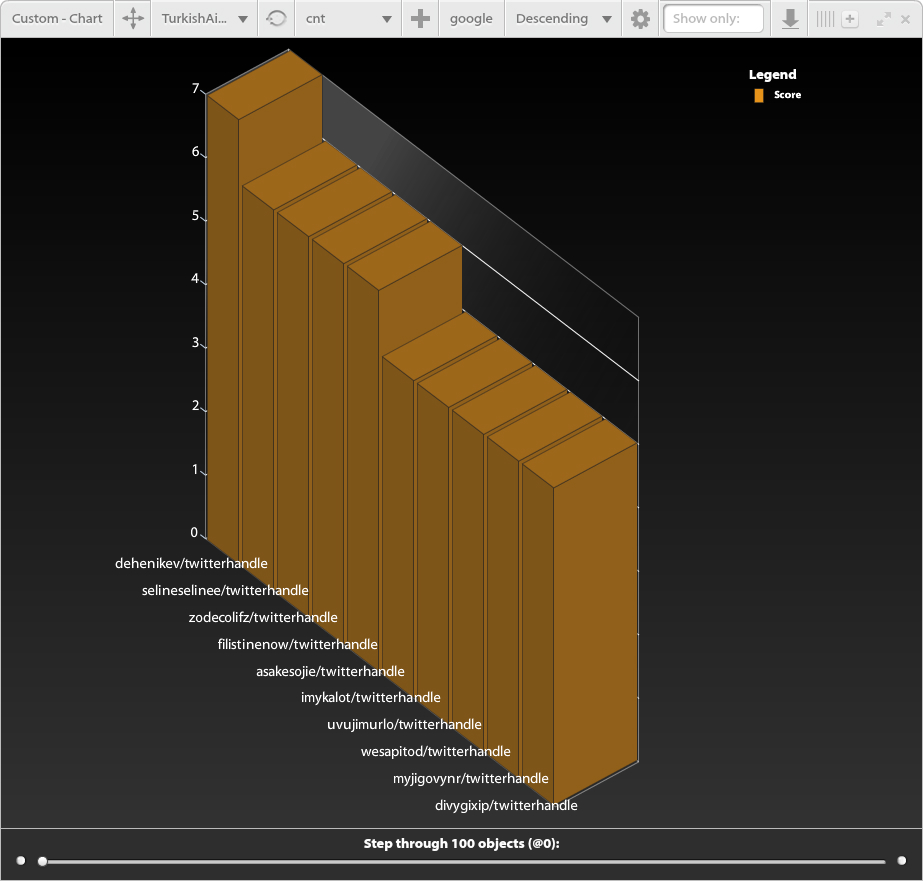
Custom Viewer - Bar Graph: (enterprise)
Very simple bar graph widget for rendering the result of custom plugins that contain numeric values.
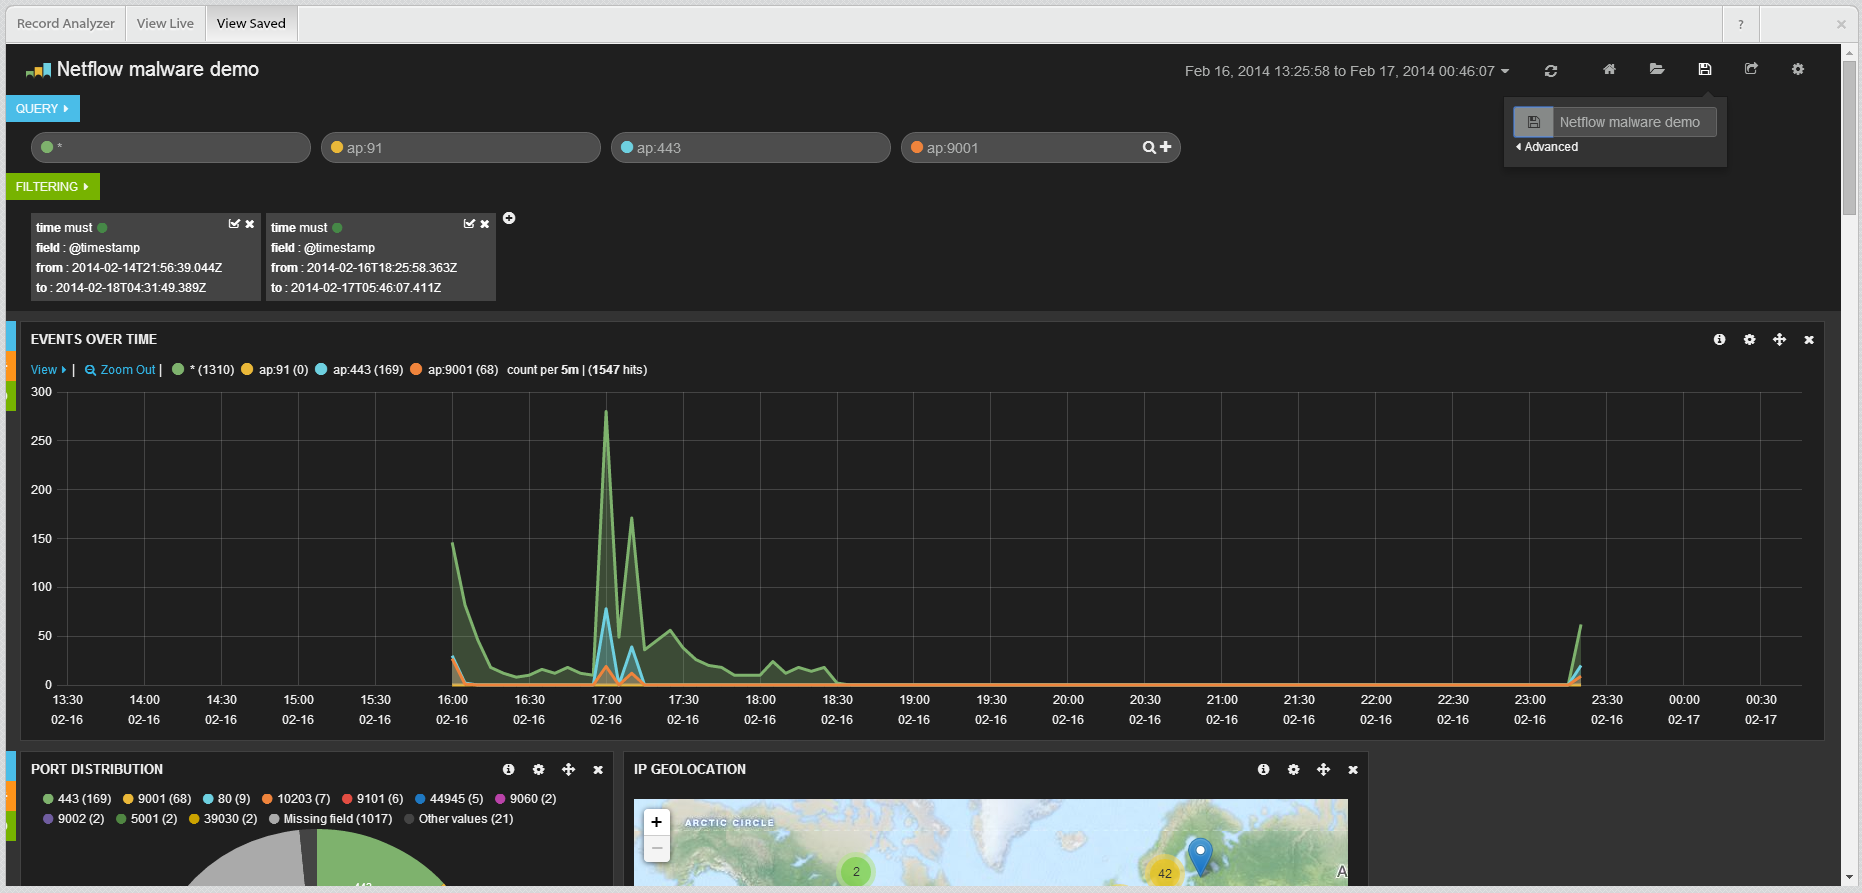
An encapsulation of the Kibana GUI that enables flexible analysis and dashboarding of the "record" object.
Alias Manager: (enterprise)
Manager for grouping multiple entities that represent the same person/place/topic, or discarding unwanted entities.
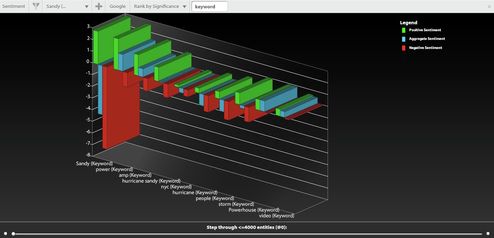
Bar chart visualization ranking entities according to positive or negative sentiment, as well as aggregate sentiment.
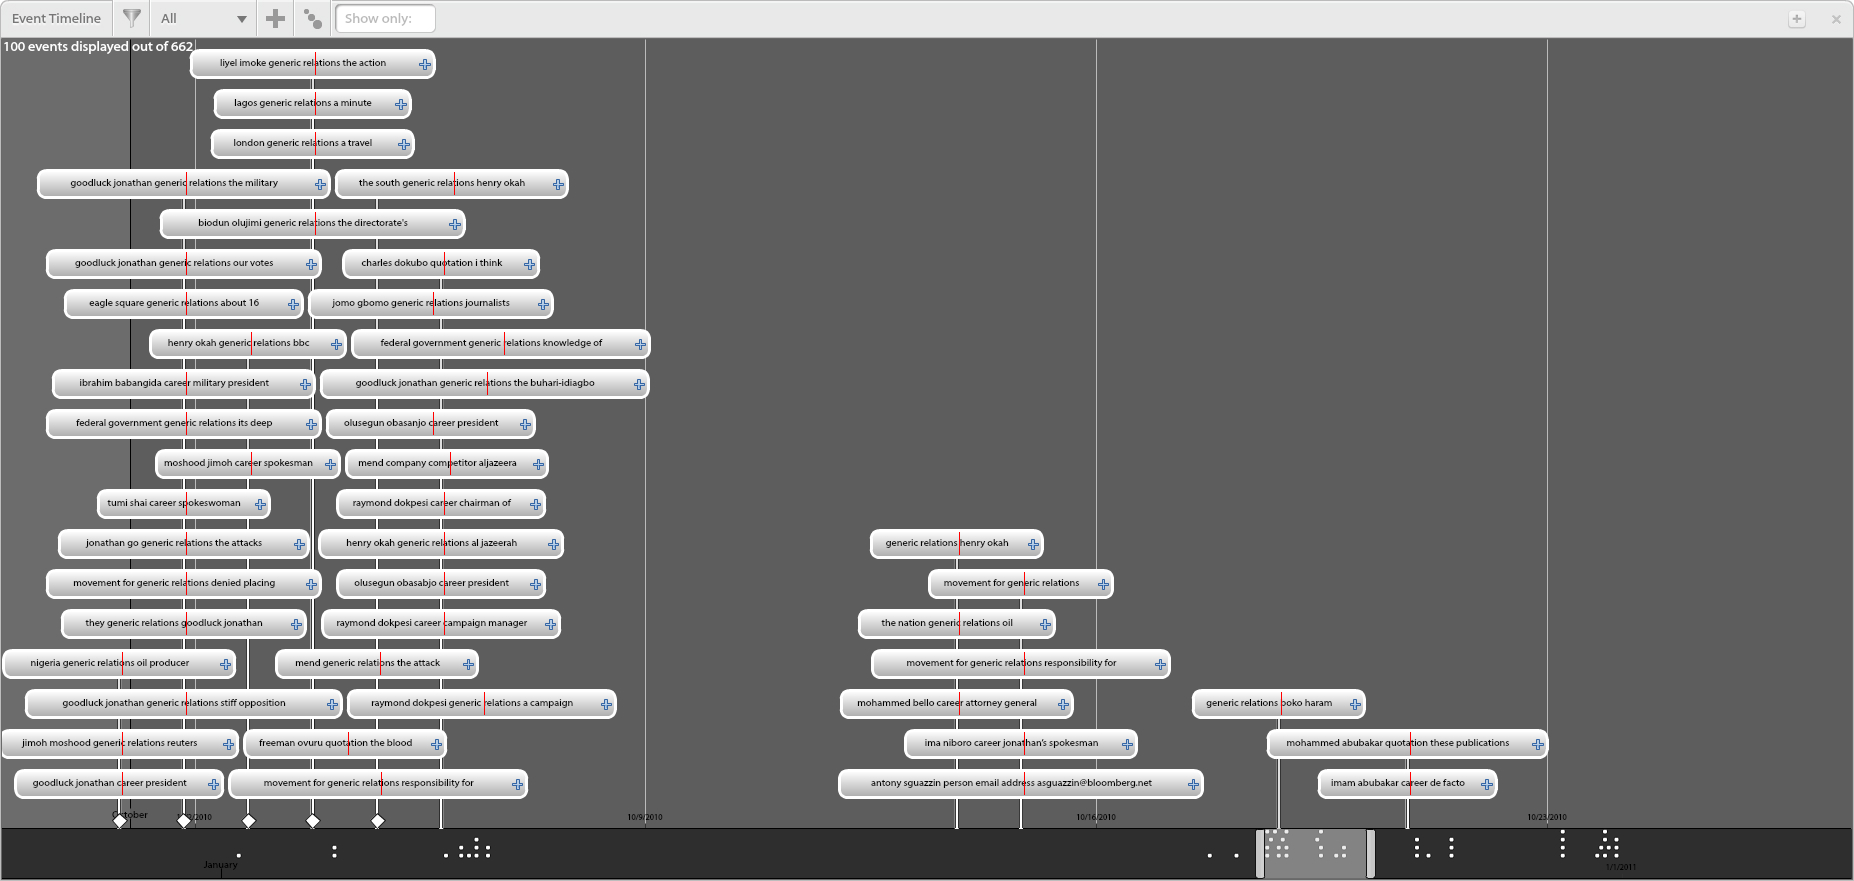
Like the document timeline, but displays each association in a document instead of the document itself - if the association spans a time range then this is displayed.
This is the enterprise equivalent of the "Event Graph" - it uses a more powerful link analysis library (the same one used in the Case Visualizer), and also supports co-reference analysis.