Understanding Community Edition
Overview
The Community Edition platform enables you to manage sources (data connectors pulling in data from databases, RSS feeds, fileshares etc.), and to visualize them using visualization widgets, in order to gain insights.
Source data in the platform is stored in JSON format as a document and the document format contains elements such as metadata, entities, and associations.
Source Management
About Sources
Sources are managed as part of Communities (see diagram on this page). All data ingested into the platform is segmented into a Community for access control, statistical integrity, and/or convenience (i.e. Financial News). Users are only able to access the communities (data) they've been added to in their user profile.
Sources are the data connectors pulling data from a database, feed (RSS), or fileshares (i.e. directories, single files (pdf/csv/xml), or ZIP). Each Source is assigned a Title (Fox News RSS), Tags (News, Politics, Conservative, Republican, US) and Type (News). Sources are then made up of documents harvested over time
About Documents
Each record or piece of data ingested by a source becomes a document (JSON), regardless of format or size. A document can be an article from an RSS feed, a 40 character Tweet, a row from a CSV file, or a 40 page medical journal
Each document JSON contains:
Series of metadata fields (title, description, source ID, date/time, etc.)
Entities (person, IP-internal)
Associations: hard (subject - verb - object) vs soft
Entities
Entities are the who, what, and where extracted from a document
Who: Person, Company, Organization
What: IndustryTerm, Product, Facility
Where: City, ProvinceorState, Country
For more information, see section Entities.
Associations
An association is an activity or relationship between entities. It can be thought of as "subject / verb / object / at location / over time", where the subjects and objects can be free text and/or point to entities within the document.
For more information, see section Associations.
Document Types
- Matching Documents: When a query is issued, often a large number of documents will satisfy the query criteria (particularly for a common query like "obama"), these are called matching documents. These documents are not directly available to the widgets. (i.e free text query for "obama" yields 4.2 million results)
- Top Documents: There are typically too many results for a person to analyze directly, therefore, a ranked subset of the matching documents (according to a configurable scoring method) is retrieved and only these are returned directly to the GUI. These top documents are an estimate of the most relevant docs. The default number of top documents is 100. (i.e. the top 100 of the 4.2 million docs are presented in the widgets)
- Filtered Documents: The Widget API allows for further filtering of the top documents within the GUI framework, i.e. drill down on a subset of documents containing a specific set of entities. This subset is called the filtered documents. (i.e. a filter for "hillary clinton" populates widgets with only those documents containing both "obama" AND "hillary clinton")
For more information, see section Scoring.
Aggregations
All matching documents contribute to the "knowledge" that a query can provide, however the documents themselves are not the only objects returned from a query. Instead, relevant information to the analysis is summed/averaged/etc ("aggregated") across all matching documents, and these are referred to as the "aggregations". Examples include:
Geo: lat/longs and their frequency in the document set
Times: number of documents per period (day, week, etc) in the document set
Entities: entity objects found in the document set, ranked by significance.
Events: event objects found in the document set, ranked by frequency.
Visualization
Visualizations are where sources and documents come to life.
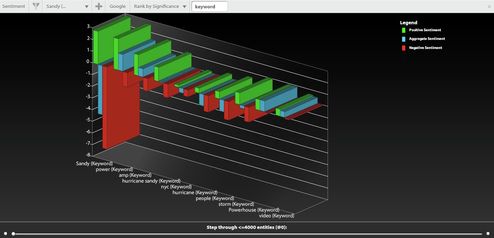
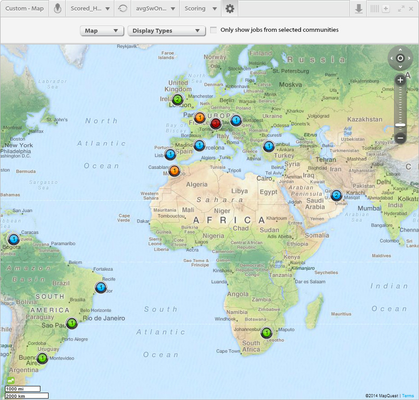
You can view complex geo-spatial and temporal document aggregations as intuitive graphs, and easily filter queries and results directly from the widgets. Furthermore, you can view document scoring parameters as metrics, including significance, relevance and frequency.
Sentiment Widget:
Map Widget:
For more information, see section Visualization.
Related Documentation:
Related Visualization Documentation:

