Dataset summarizer
Overview
The dataset summarizer is an analytic module accessible via the Plugin Manager. It is intended to give analysts a quick understanding of large unfamiliar semi-structured datasets.
It generates a JSON object that describes all the different fields in semi-structured data - their types, example values, statistics, etc.
It can be run on JSON/CSV/XML files stored in HDFS directories, ingested "infinit.e" documents, and the output of other custom jobs (records: coming soon!)
Running the dataset summarizer
Configuration
Navigate to the plugin manager
Select the "SourceAnalyzerTemplate":

From the same dropdown, now change the selection to "Copy Current Plugin" - this will create a copy from the template:
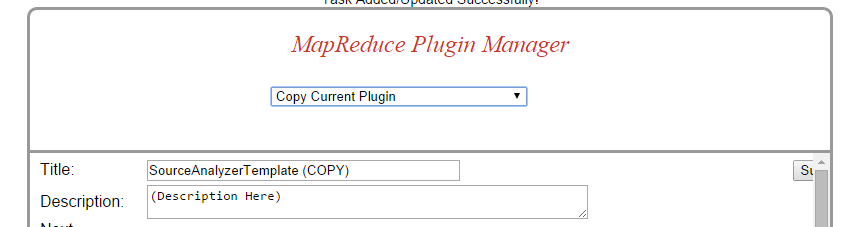
Set the Title and Description and press "Submit" (you can just see the button in the far right in that screenshot)
Now select the data to run over:
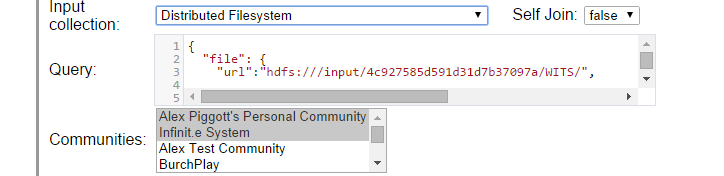
The Input Collection can be one of the following:
- Distributed Filesystem - to read from HDFS
- Document Metadata Collection - to read from already ingested "Infinit.e" documents
- The output from any custom job
For files, the same syntax as the File extractor is used. For Documents, either a MongoDB-style or an Infinit.e query can be used. For custom results, a MongoDB-style query can be used. These topics are covered in more detail here.
Setting the communities has two effects:
- For documents, it restricts the input data to documents from those communities
- For all input types, it sets the access permissions on the output
Finally, set the configuration in the "User arguments" text area:
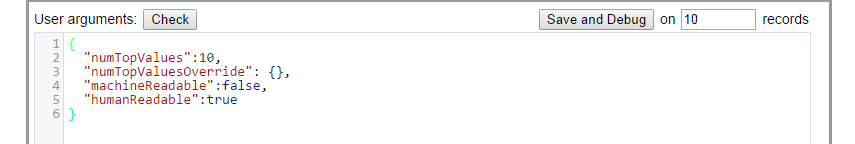
The configuration JSON is specified below.
Execution
The "Save and Debug" button shown above is useful for sanity-testing the output before big runs. Note that it overwrites any existing results, so use with caution.
To run on the full dataset specified, either press the "Quickrun" button (not recommended for larger datasets - it just polls the API until done), or change frequency from "Don't Run" to "Once Only" and then "submit"
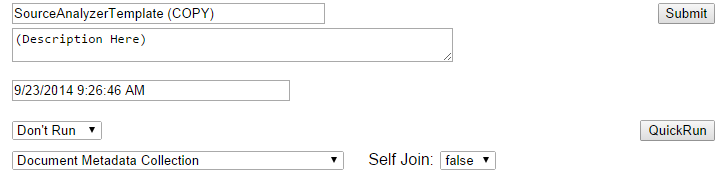
The output can be viewed in a separate tab from the "Show results" button:
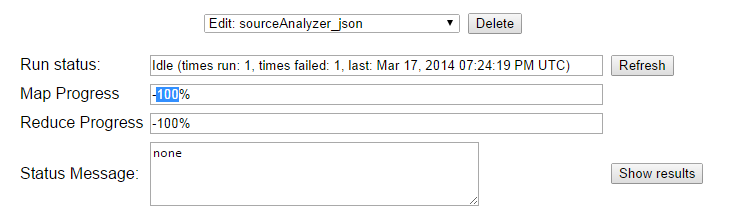
The output format is described below.
Configuring the dataset summarizer
JSON format: to be copied into the "User argument" text area of the plugin manager.
{
	"numTopValues": integer, // For string fields, the number of "top" (highest frequency) values to display (defaults to 10)
	"numTopValuesOverride": {
		string: integer, // Enables the user to specify custom "top values" for different fields (in dot-notation, except with "." replaced with "%2e", eg "field1%2efield2" not "field1.field2")
	},
	"humanReadable": boolean, // If true (the default), then the JSON is formatted for humans to read easily
	"machineReadable": boolean // If true (default: false) then will output the JSON is a machine-readable format for follow-on processing
}
The dataset summarizer output
The data summarizer generates a the following JSON object
{
	"docCount": integer, // total number of docs processed
	"fields": {
		string: { // the string is the field name, except with "." replaced with "%2e" as described above
			"fieldName": string, // the actual field name

			// Human readable output:
			"frequencyInfo": string, // Frequency information about the field, see below for format
			"typeInfo": [
				string, // Statistics on the different types of the field, see below for format
			],
			"sampleStringData": [
				string, // For string values, the "N" most common values ("N" taken from the configuration specified above, default 10)
			],
			"numericDataStats": string, // For numeric fields, some simple statistics, see below for format

			// Machine readable output:

			"count": integer, // (see human readable format, frequencyInfo.field_cnt)
			"objectCount": integer, // (see human readable format, frequencyInfo.object_cnt)
			"pctInParent": number, // (see human readable format, frequencyInfo.pct_parent)
			"pctInTotal": number, // (see human readable format, frequencyInfo.pct_total)
			"exampleValues": [
				"value": string, // One of the top occurring values (string fields only)
				"count": integer, // The number of times it occurs
			],
			"minValue": number, // For numeric values, the smallest value seen
			"maxValue": number, // For numeric values, the largest value seen
			"avgValue": number, // For numeric values, the mean value seen
			"numberCount": integer, // The total number of samples (in theory - all the times the field has a numeric value) used in the above statistics

			"typePcts": {
				string: number, // the string is the type name one of (object, array, string, text, number_float, number_int, bool)
								// the number is the % of the time the field is that type
			},
			"typeCounts": {
				string: integer, // as above, but count instead of %
			}
		}
	}
}
The human readable version has the following formats:
- frequencyInfo: "field_cnt=%1 (obj_cnt= $2% parent_cnt=$3%); pct_parent=$4, pct_total=%5"
- field_cnt is the total number of instances of the field
- obj_cnt is the number of types that the field contains an object (or array of objects) instead of a primitive value - discarded if == field_cnt
- parent_cnt is the number of parent instances in which this field occurs (can be different to field_cnt it the parent_cnt is an array)
- pct_parent is the % of parent fields in which this field occurs
- pct_total is the % of objects (ie docCount) in which this field occurs
- typeInfo: "<type> (<total_cnt>, <total_pct>%)"
- type is one of: object, array, string, text, number_float, number_int, bool
- total_cnt, total_pct: are the count and percentage of that type for that field
- Note that types can overlap, eg [ 1, 2, "3" ] would be 3x array, 3x numeric, 1x string
- sampleStringData: "<value> (<count>)"
- numericDataStats: "min=$1 max=$2 avg=$3"
- min is the smallest value seen
- max is the largest value seen
- avg is the mean value seen