Quickstart
Access
In order to access the Community Edition application you must first have an account. This can be created by an existing Administrator.
After you have your account established you can navigate to the address of your server.
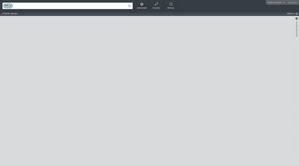
After you have successfully logged in, you will be presented with a blank canvas. If you have accessed the software previously you will be presented with any previously opened visualizations (widgets).
Searching using Community Edition
Once you are inside the application you can use the Quick Search to start the Query Focused Dataset (QFD) process. This interface allows you to chain queries based on free text and exact field matches as well as boolean operations. For more advanced searches you can use the Advanced Search feature.
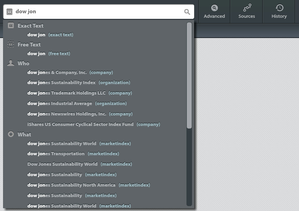
Once you begin typing text into the Simple Search you will start to see "search as you type" functionality. This is broken out by entity type (who, what, where) to better help you define and refine your query. As in the example above, the user has the option of performing an exact or free text query on the term "dow jones", or selecting one of the individual entities to query against (i.e. who: dow jones & company inc. (company)). This allows user to refine further refine queries based on the available entity data.
After you have made your selections you are ready to issue your simple query by clicking the search button or clicking on enter. Global searches can also be performed using "*" operator. This will pull back the latest information in the environment.
For more advanced searches you can use the Advanced Search interface (tab next to the query bar). This will allow you to construct very complex search criteria, adding in additional search terms, associations, and geographic or date parameters. The video below illustrates an example how to use the Advanced Search interface.
Visualizations (Widgets)
Once you are inside the application and have issued your query from the Simple Search or Advanced Search you can begin to investigate and analyze your results by adding one or multiple Visualization Widgets to the canvas.
We have included a handful of "out-of-the-box" Visualizations to assist in the analytical process. Instructions are available that illustrate how to develop and integrate custom widgets.
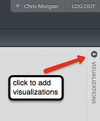
In order to add visualizations to the canvas you can double click on the icon, click the + at the top right of the icon, or "drag" the visualization on to the canvas. Included are several starter visualizations which are outlined below.
- Map displays a geospatial view of the QFD that the user submits. This maps out the geo locations that are extracted from the documents that are brought back from the query.
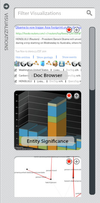
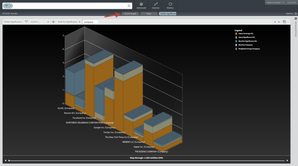
- Entity Significance creates a bar chart visualization ranking entities using metrics such as significance, coverage, and frequency. As you mouse over you can see the calculated values.
- Doc Viewer provides a result list view of the information that includes ranking and sorting as well as way to view the extracted entity values. From this interface you can also filter your queries.
- Event Graph provides a semantic graph visualization of entities returned by the query focused dataset and provides sub graph functionality by filtering the entity categories.
- Timeline provides a temporal view of document results.
Here is short video illustrating how to use the visualizations.
Canvas
The Community Edition user interface was designed to provide a lot of the same rich features similar to that of operating system within a browser. The canvas provides the palette to display the visualization interfaces and manipulate them by doing such things as tiling or cascading as well as resizing and moving.
Expanding the visualization tray displays a list of available widgets with their thumbnail.
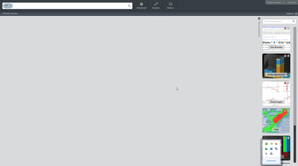
You can add up to four visualizations from the tray on the right side of the canvas. After you have added them your interface might look like something below.
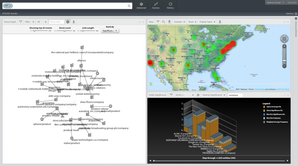
From here you have few options. You can maximize widgets, and tab between open widgets using the navigation buttons at the top of the workspace.
The example of above illustrates the interface after you have issued a tile command to layout the available space in the browser.
Filtering
Filtering is offered throughout the environment that will help you to refine your query focused dataset. This can be accomplished through a mixture of ways. Most of the out of the box widgets provide a way for you to add filters to the query or directly filter by adding individual items to the filter set. The video below illustrates how filtering works with a few of our widgets.
Each widget has a toolbar header that provides functionality to filter to page through results among other types of functionality. From each you can mouse over the icons to be provided a tool tip that describes the action. We will discuss this filtering mechanism in more detail later on.
Here is short video illustrating how you perform filtering in two of the available widgets.