Tip 1: Start with the query metrics widget
The general visualization approach is to highlight aggregated statistics i.e. the frequency/significance of entities & associations, document & entity counts by hour/day/week or clustered by geo, etc.
Before diving into the graphical views, however, the Query Metrics widget is useful for getting an overview of the data.
Bypass the initial 'Source' view and start with the 'Entities' or 'Associations' breakdowns.
The 'Entities' view lists all the different types of entities extracted from either the document metadata or text using NLP (i.e. VulnerabilityCategory, OperatingSystem, PrivateDNS), as well as their document counts
The 'Associations' view lists the different the top level "verb categories" between entities (i.e. vulnerability_detected, affects, indicates).
When you find an entity/association of interest, click the button to add to query, or to run an external google search.
Tip 2: Other useful widgets
Doc Viewer: View the individual documents/events and their metadata, ranked by score or date, along with a breakdown of entities, geotags, and associations.
- Useful for analyzing specific documents once filtering or querying has reduced the dataset to manageable size.
Entity Significance: View the entities across all documents, ranked by score or frequency.
- Useful for identifying the entities that are most common or significant within a dataset.
Map: Geographic display of geo-tagged documents and events, as well as locations mentioned in content.
- Useful for visualizing the global distribution of a dataset.
Timeline: Shows documents and document counts over time.
- Useful for viewing large volumes of aggregated log events
Event Graph: Automated link analysis chart of associations.
- Useful for identifying intersection points/nodes between entities
Event Timeline: Displays timestamped associations between entities over time, including the start/end times of long running events
- Useful for seeing the temporal aspect of associations (the event graph does not include time as a dimension)
Tip 3: Using the source manager and auto-complete
Infinit.e's Community/Source data model allows for querying across multiple data silos at once, or a narrow search against one single data source.
Access the Source Manager from the 'Sources' button to the right of the query bar.
Access the Community list, and select the appropriate communities for your query.
Mouse over the icon and 'Select All' or 'Select None', then check the individual communities for your query.
By default, all sources in a selected community are activated for querying. To narrow the scope of your search, turn off sources by clicking on their row in the source list, or 'Select None' from the drop-down, and select only those sources you want to query.
Once you've finalized your community and source selections, you must run a search in order to update your workspace.
When entering a query term in the search bar or the advanced query builder, a drop-down will populate with recommended entities indexed within the selected communities. The first two options are always Exact Text or Free Text search. The following entity categories (dimensions) are Who (i.e.person, company, organization), What (product, operatingsystem, vulnerability), or Where (city, state, region).
Note: When querying across multiple sources/communities that do not have a unified ontology, do not rely on indexed entities or keywords to return all matching results. In these cases, using Exact Text searches will ensure all matching results are returned.
Tip 4: "Show only" Widget vs. Workspace filtering
Widget Filtering
Each widget contains a Show Only: text box which allows the user to drill down on specific entity names or entity types. Most common uses for this are in Entity Significance, Event Graph, and Doc Viewer.
i.e. In Entity Significance, enter company or product in the Show only: text box
Workspace Filtering
Another option is to filter your result set across the entire workspace, think of this as a temporary sub-query within your query results. Examples:
Entity Significance: Double click on an entity to filter, the other widgets in your workspace will populate with only the documents that contain that particular entity.
Map: Click the icon to 'enter click-to-filter' mode, then click on a document cluster to investigate the corresponding documents in the Doc Viewer or Entity Significance.
Doc Viewer: Select an entity from one of the document data tables, mouse over the icon at the top left of the section header and select 'Filter Selected Items' from the list.
To remove a filter, click the button located just below the query bar, this will revert the workspace back to the original query results.
Tip 5: Common use cases for dragging between widgets
The following widgets support drag & drop of entities and/or associations into the Case Visualizer OR into the query bar:
Doc Viewer: For Individual entities, geotags, or associations, select and drag from the list under the document details, or by select the entity/entities and drag the icon from the widget toolbar. To add all of the entities/associations in a document, check the document in results list and drag the icon.
Entity Significance: Individual or multiple entities can be selected and dragged out of the widget by holding Ctrl + clicking the desired entities, then dragging the to the query bar or Case Visualizer. Drag all ten entities by deselecting any individual and dragging the button.
Event Graph: to drag individual associations (edges) from the Event Graph to the query bar or Case Visualizer, click on the edge label and drag. Also, copy all nodes/edges currently displayed in the Event Graph by dragging and dropping the button.
Tip 6: Exporting data as text or images
Workspace Link: 'Copy workspace link to clipboard' URL to the clipboard that will return you (or other users) to the current query, community/source selections, and widget configuration when pasted into a browser.
JSON: 'Export JSON for current data' saves a file to local disk containing the JSON returned from the query. The format is described here.
CSV: From within the Entity Significance widget, export a CSV including all entities list on the graph along with the entity type, significance/relevance score, doc counts and coverage, etc.
RSS: 'Create RSS feed for current query' opens a new tab in the browser containing a URL that generates an RSS feed for the current query. This feed can be used in RSS readers or alerting tools supporting RSS (an access key is embedded in the URL so no authentication is required on the RSS reader side).
Screenshots: Each widget contains a button at the top right of the widget toolbar (when moused over) that generates a .png of the widget contents - this .png will display in front of your browser window - it can be dragged and dropped into a Powerpoint or email, or you can right-click and save to local disk.
Tip 7: Saving your working using the Case Visualizer and Case Manager
The Case Visualizer provides a blank canvas for dragging and dropping entities and documents from the other visualization tools to develop a link analysis diagram.
Before dragging any entities into the Case Visualizer, open the widget and click '+ Add New Case', give the case a title and click 'Create'. This generates a corresponding case folder in the Case Manager webapp.
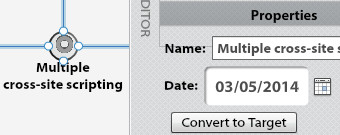
As a you create link diagram, convert entities (nodes) to 'Targets' to create a profile in the case folder: this archives the query used to locate the entity or the document the entity was pulled from, and provides a space for analysts to comment and add manual relationships.
Documents related to the case can be dropped onto the middle of the graph and saved as 'Supporting Evidence' in the case folder.


