GeoTemporal
The GeoTemporal visualization is displayed under the Workspace.


Description:
Use GeoTemporal to view time periods in which named entities were mentioned, together with counts of the mentions for each time period. You can also enable/disable the heatmap.
| Field | Description | Notes |
|---|---|---|
 | Widget label. | |
 | Toggle heatmap on/off. | |
Selection dropdown
| Use this dropdown to select the type of associations which will display on the timeline. All: Events, Facts, and Summaries are displayed. Events: Only events are displayed. Events link multiple entities (via "entity1_index", "entity2_index", "geo_index") and represent a transient activity (i.e. travel) Facts: Only facts are displayed. Facts link multiple entities like "Events" but represent (transient or permanent) relationships (i.e. being president) Summaries: Only summaries are displayed. Summaries generally link one entity to a free text (i.e. a quotation: "Obama says..."). | |
 | Add visible time range to query. See Common Functionality for more information. | |
 | Set time decay date. See Advanced Options for more information.
|
|

Event Information
Event information displays when you click on a plus sign for one of the events
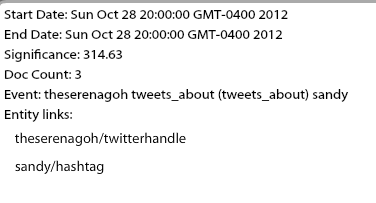
Entity Links
Entity links displays when you click on one of the entity links from the event information.
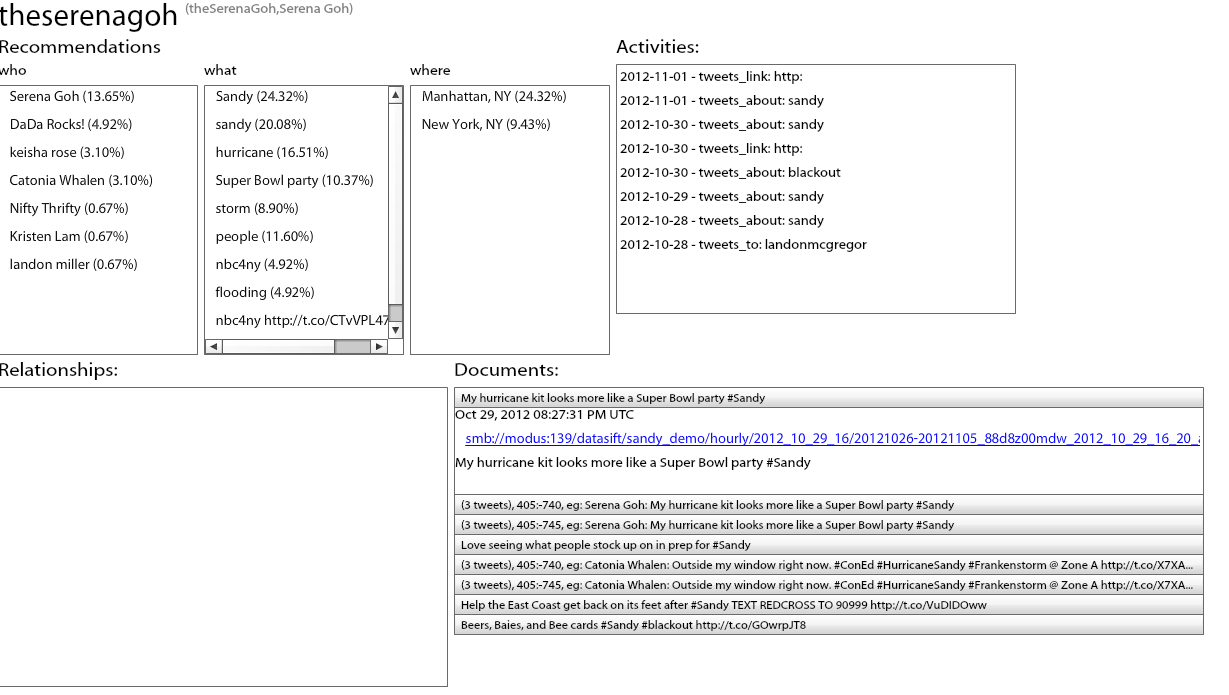
Description:
Use entity links to explore temporal relationships between the entities.
| Field | Description | Notes |
|---|---|---|
| Who | Displays relationships to other entities of type "Who." Percentages reflect ranking based on relationships to all other entities of type "who" in the current data set. | |
| What | Displays relationships to other entities of type "What." Percentages reflect ranking based on relationships to all other entities of type "what" in the current data set. | |
| Where | Displays relationships to other entities of type "Where." Percentages reflect ranking based on relationships to all other entities of type "where" in the current data set. | |
| Activities | Activities for the current entity profile. | |
| Relationships | Key associations with other entities (facts, events, summary) | |
| Documents | Links to documents in which instances of the entity occur. |
In this section: